Share This


Blog
Welcome!

My name is Claus Topholt and this is my personal blog. I’ve been delivering business-critical IT consulting and solutions for 15+ years.
read moreSoftware Robots That Can Automate Anything
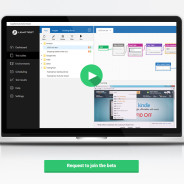
During the last 12 months, I have worked very hard together with my team of amazing developers on a new software product called LEAPTEST Automation Suite. LEAPTEST Automation Suite is a platform to configure software robots to automate anything across browsers, applications and devices. With this unique tool, it only takes a few minutes to configure and maintain a software robot because of the code free and intuitive building block workflow based on advanced image- and text recognition. Here’s a quick, 4-minute introduction to it all: https://www.youtube.com/watch?v=XSgv7OqoMHg There’s lots more to learn about the new company and product on...
read moreA Simulated Distributed Microprocessor
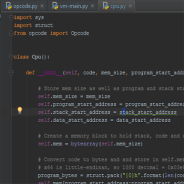
Here’s a virtual machine that simulates a microprocessor, built in Python.
read moreMicrocorruption Security CTF
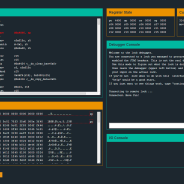
Capture the Flag and remind yourself that devices are made by people like you and me.
read moreMysterious App Pool Crashes? WinDbg is Your Friend

Investigate root causes of application crashes with Windows Debugging Tools.
read moreBoosting Performance and Productivity
If you do it right, MongoDB can boost performance and productivity immensely.
read moreRemote Copy with Powershell and MongoDB
MongoDB and Poweshell are powerful allies in corporate infrastructure environments.
read moreA Brand New .NET Language: Top#

I recently implemented a full .NET programming language plus MSIL compiler.
read moreDynaTrace to the Rescue!

DynaTrace from Compuware is one of the world’s leading monitoring and profiling tools for live / production environments. It works in both Java and .NET environments and enables you to quickly perform root cause analysis on anything from performance bottlenecks to error storms. There are various vendors in the Application Performance Management (APM) space, including AppDynamics and the cloud-based New Relic. Most of these other products are more geared towards monitoring, whereas DynaTrace is more geared towards profiling, which is better suited for the way troubleshooting normally works, in my opinion. DynaTrace has both a browser and a server component, and by using both it’s possible to understand what happens all the way through a request. The browser component called Ajax Edition is free, whereas the server component comes with a (substantial) license cost. My focus is on the server component, which in brief terms requires a “collector” server to be installed on-site and “agent” services to be installed on each server you want monitored/profiled. Depending on the amount of assemblies and namespaces being instrumented, this leads to a performance degradation of typically between 10-25% on the server — a price often worth paying in order to troubleshoot live incidents. A “client” application is then used to connect to the server and analyze data as it streams in. This may sound a little bit complicated, but it’s actually very easy and quick to setup. Over the last 3-4 years, I have used DynaTrace on a more or less daily basis to perform the following tasks: Understand performance patterns in dev / test environments during code review Understand performance bottlenecks in live / production environments Troubleshoot live incidents, particularly related to database and external integration points Because of confidentialy constraints, I can’t show client screenshots, but here’s an example taken from Compuware’s APM blog. In the example, a SharePoint page takes almost 7 seconds to respond. By diving in to the callstack in DynaTrace, it becomes immediately clear what web part is to blame and that most of the time is spent in a WaitHandle: As explained in the blog post, DynaTrace is used to identify the root cause of the problem — in this case, 10 threads doing simultaneous web service requests to the same remote host. And because there is a default limit of 2 simultaneous connections (which can be tweaked) the threads spend most of their time waiting for their turn to do the call. I have used DynaTrace to quickly troubleshoot otherwise very hard to find issues on Microsoft SharePoint sites, Microsoft CRM, ASP.NET websites, console applications, Windows services — you name it. Any managed process can be profiled and monitored with DynaTrace. Here are a few real-life examples: LINQ can be a performance killer. For instance, in earlier versions of .NET, there was a huge difference between calling myList.Count and myList.Count(). These days, it’s typically more a matter of people misunderstanding the “magic” that LINQ does and end up with things like myArray.ToList().First(p => p.MyNumber = 500). That’s a whole lot slower than just iterating through the array with a for-loop. Not a big deal if you don’t do it all the time, but people have a tendency to use this sort of thing inside caching mechanisms that get called hundreds of times per page...
read moreCreate Your Own CLR Profiler in C#

Here’s how to build a CLR profiler in C# that can be used in dev and test scenarios.
read more